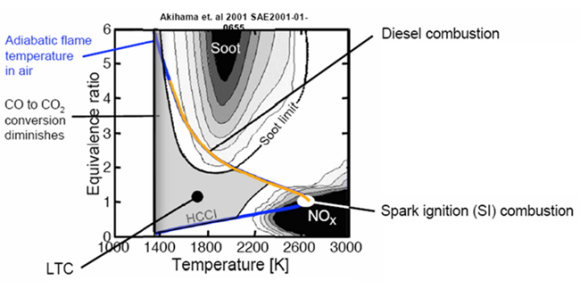
In the graphical depiction above, one can see the tendencies of soot and NOx formation as functions of fuel-air equivalence ratio and temperature in diesel combustion.
The most important information that can be obtained from the graph about the emission of NOx is that the critical equivalence ratio for NO formation in high temperature and high pressure burned gas, typical of engines, is close to stoichiometric ( around 0.85< ER <1.1). Similarly, the critical time period for NO formation is when burned gas temperatures are at a maximum i.e. between the start of combustion and shortly after the occurrence of peak cylinder pressure. It can be seen in the graph that NOx formation is most when combustion temperature is around 2600 K or more. In one sentence, we can say that NO forms in the close-to-stoichiometric burned gas regions and the magnitude of the stoichiometric burned gas temperature controls the NOx emissions (there exists a relationship between the adiabatic flame temperature and NOx emission as seen in the graph).
When it comes to soot, since it is a consequence of incomplete combustion of fuel hydrocarbons inside the cylinder, the more fuel rich mixture (higher equivalence ratio) we have, the higher is the tendency of its formation. It can be seen in the graph that SI combustion usually does not tend to have soot formation and this is because the combustion takes place around stoichiometric conditions. In diesel combustion however, soot formation is highly promoted at fuel rich conditions of equivalence ratio 4.5 or more and at around temperatures of 1800 to 2000 K (less than for NOx). The lack of enough oxygen to oxidize all fuel hydrocarbons at those conditions lead to higher rates of soot formation. When we cross the 2500 K or so temperature mark, we have reached the soot limit after which if the combustion temperature is increased, soot formation does not happen and increased NOx formation starts instead. So in general, soot and NOx formation rates have inverse relationship between them associated with the equivalence ratio and burned gas temperature.
In the graph we can also see the control conditions for CO. The CO emission is controlled primarily by the fuel-air equivalence ratio. For fuel rich mixtures CO concentrations in the exhaust increase steadily with increasing equivalence ratio as the amount of excess fuel increases and the conversion of CO to CO2 diminishes. However, diesel combustion usually takes place on the lean side of stoichiometric so CO emission from it is not so important.
Another interesting information that can be derived from the graph is about the HCCI combustion. We can see that the HCCI combustion area is rather small and the objective is to have combustion at low peak combustion temperatures and pressure. Effective HCCI combustion can lead to practically no NOx emission and soot formation but control of mixing, auto ignition event, temperature and pressure is very difficult to achieve for its successful implementation.
